Checkmk 2.3
Discover the new possibilities Checkmk 2.3 brings to your monitoring. Gain insight into the performance of your applications from the user’s perspective with the now integrated Synthetic Monitoring add-on, and benefit from our enhanced out-of-the-box capabilities: modern web service and certificate monitoring, completely revamped monitoring of MS SQL databases, numerous visual enhancements, simplified workflows, and many other features that simplify the daily work of IT teams. With Checkmk 2.3, you get a complete view of your entire IT stack.
Test like a robot, monitor like a pro
With Synthetic Monitoring, Checkmk enhances its IT monitoring to include application functionality monitoring. Available from version 2.3, the add-on, which is based on the trusted Robotmk, allows you to test all your applications for functionality, performance and availability. As a result, Checkmk 2.3 unifies reactive and proactive monitoring within a single platform.


Experience your applications from the user perspective
Test your business-critical applications from the perspective of users to ensure an ideal user experience for your services and products. With Synthetic Monitoring in Checkmk 2.3, you are able to easily test any of your applications, from native Windows applications to modern web applications, and across different locations and devices. Detect and rectify frustrations, obstacles, and disruptions for your customers, and improve their satisfaction.
Synthetic Monitoring – Simple, flexible, scalable
Based on the powerful Robot Framework, Robotmk enables individuals without deep technical knowledge to create hundreds of different tests, thus covering a wide range of use cases. Monitor every device and browser and receive detailed insights through pattern-based monitoring.


All-in-one platform for IT infrastructure and Synthetic Monitoring
The add-on integrates seamlessly into the leading automation test system, the Robot Framework, without needing to adjust existing tests. Maintain full control over the test parameters, identify problems in advance, and improve the availability of your applications from the Checkmk UI.
Monitor anything out-of-the-box
Easily expand your monitoring to include web services, data center infrastructure, networks, and Kubernetes. The new release makes it easier than ever to keep an eye on everything important in your IT – right out-of-the-box.


Modern web services monitoring
The newly revised HTTP check makes availability and performance monitoring of your web services a breeze. With simple management and configuration, it provides you with meaningful data about the status of your HTTP(S) services.
Flexible configuration, powerful monitoring
Thanks to the modern web service monitoring in Checkmk 2.3, from now on, you only need one rule to include various endpoints in your monitoring, saving time and keeping your monitoring organized. Monitor your websites including their certificates in one service with Checkmk, and maintain an overview even when monitoring hundreds of websites. Receive detailed alerts about various issues with your website, including:
- error messages from your website
- delays in response time
- running an outdated TLS version
- missing or incorrect content
- the expiration of your website's certificate
This way, you can easily ensure the stability of critical web services.


Certificate monitoring for your applications
Increase protection against man-in-the-middle attacks with Checkmk's dedicated in-depth certificate monitoring. Version 2.3 includes not only the monitoring of web service certificates, but also those of other applications, such as databases. Enhance the security of your IT infrastructure with the new certificate monitoring of Checkmk, uncomplicated, clear, and scalable.
Monitor any MS SQL database – locally or in the cloud
Discover the fully redesigned MS SQL plug-in by Checkmk and experience the next generation of database monitoring. The agent plug-in is based on an entirely new architecture, leading to significant performance gains and a wide range of new opportunities in monitoring MS SQL databases, including:
- auto-detection and monitoring of locally running databases
- in-depth monitoring of remote databases, e.g., Microsoft Azure SQL
- support of a wide range of special MS SQL setups
- custom handling for long-running queries
With Checkmk 2.3, you can monitor any database compatible with MS SQL queries. It doesn't matter whether it's operated locally, or on a remote server, or in the cloud. Built by database experts for everyone.

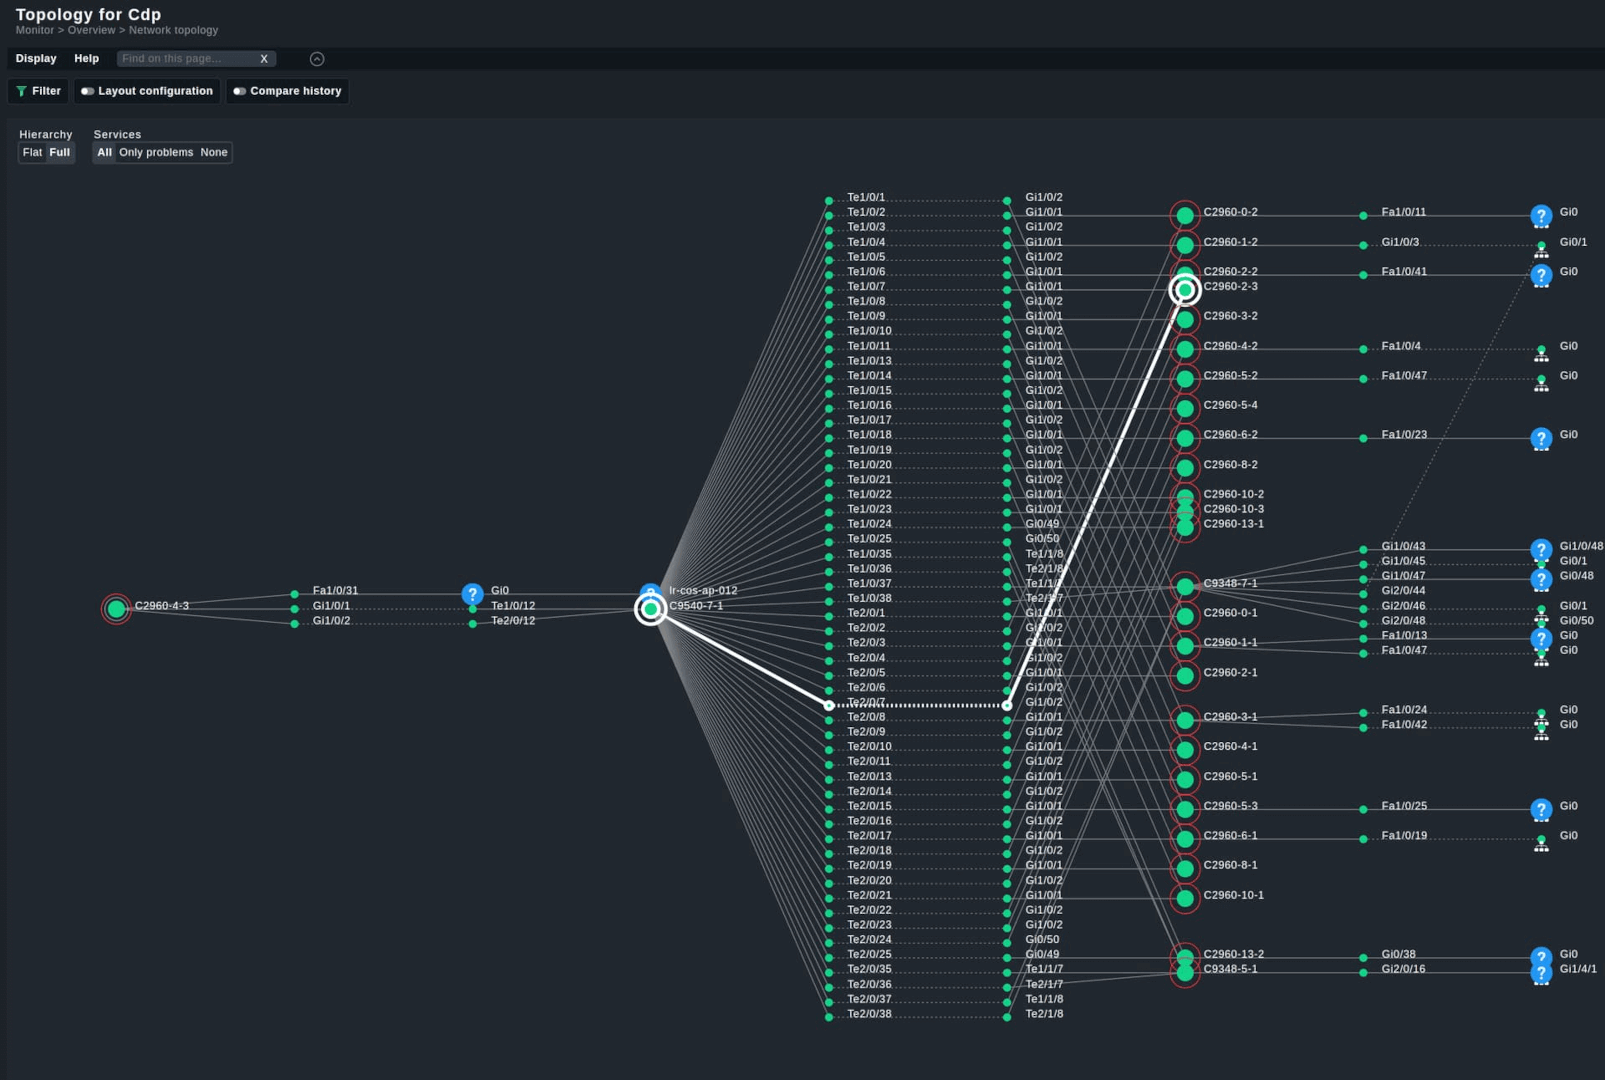
Visualize your network topology
Visualize your Layer-2 network connections with Checkmk 2.3. Gain clear insights into your network topology and customize it for further analysis according to your needs:
- visualization of all hosts and the relationships between them
- combined view of hosts and interfaces
- focus on hosts and interfaces with problems
Hover over any Layer-2 connection to immediately view all relevant connection details for an in-depth analysis.

Monitor any Kubernetes setup
The latest version of Checkmk further expands its Kubernetes monitoring. All commercial editions of Checkmk now support the most popular Kubernetes distributions:
- Vanilla Kubernetes
- AWS EKS
- Google Cloud GKE
- Azure AKS
- VMware Tanzu
- Red Hat OpenShift
As one of the few Google Kubernetes Engine Autopilot partners, Checkmk offers privileged partner workloads specifically for GKE Autopilot. This enables efficient monitoring of GKE Autopilot clusters and ensures that there are no monitoring gaps.
OpenShift monitoring is now also available for Checkmk Enterprise and Checkmk MSP. With this update, users of any commercial Checkmk Edition now benefit from comprehensive monitoring and analysis of the OpenShift infrastructure – from the cluster level down to the pod level.
Monitor anything in your data center
With version 2.3, Checkmk expands its suite for data center monitoring. Benefit from the support of new infrastructure components and new views for effective analysis of IT efficiency in data centers. Additionally, Checkmk 2.3 provides a comprehensive overview in large environments with the new Top lists feature.
Extended Nutanix monitoring
Checkmk 2.3 further enhances Nutanix monitoring. It now provides metrics for IO, CPU, and memory utilization at the cluster, host, and VM levels. Moreover, thanks to new views, the IT utilization of Nutanix servers can be easily understood. The views deliver historical average values over the last 365 days for CPU, memory, and file systems, allowing data center operators to measure IT utilization in their data centers and identify optimization potentials.
New PureStorage FlashArray monitoring
The new special agent for PureStorage FlashArrays allows for seamless monitoring of your flash infrastructure. The agent includes the configuration for authentication and uses the REST -API of the FlashArrays to deliver data on:
- interfaces
- alerts
- overall capacity and volume capacity
- fans


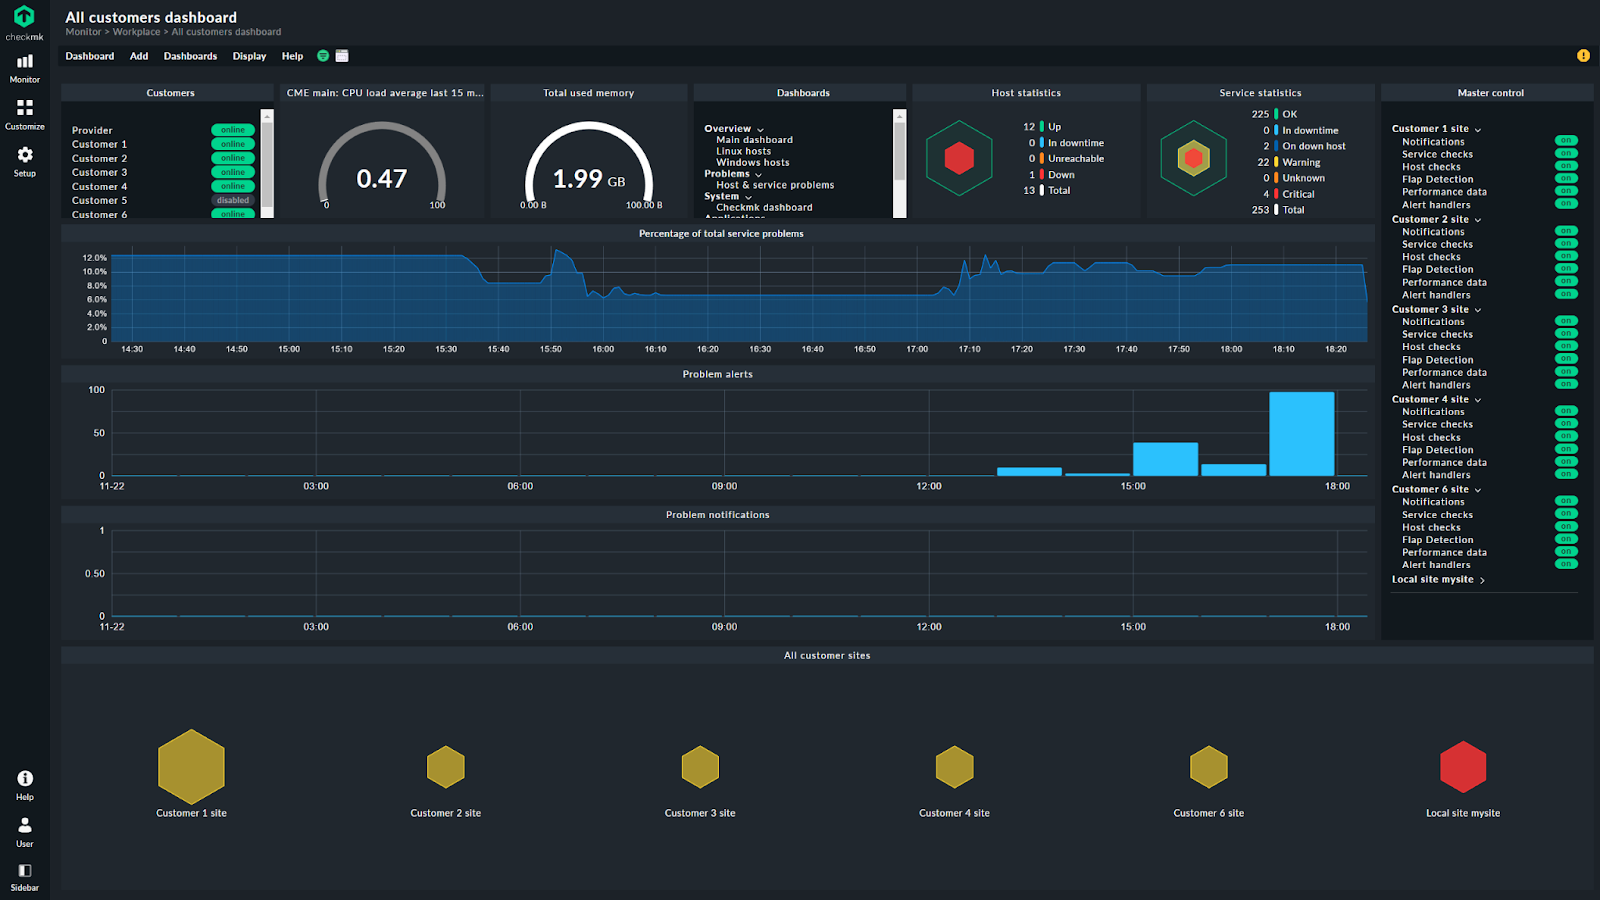
Better visibility in large environments with Top lists
Top lists, a community-requested feature, is making its debut in Checkmk version 2.3. This dashboard element will provide IT teams with an overview of the most important aspects of their IT infrastructure. Top lists offer an easy way to visualize the most critical hosts or services. This allows users to quickly identify underutilized resources or the biggest consumers of a specific metric, such as CPU, Memory, or Disk. Top lists can be sorted by metric and limited to a specific number of hosts, helping to directly identify and prioritize problems. As a dashboard element, the functionality can be easily integrated into dashboards for easy access, facilitating the daily work of IT teams, even in very large environments.
You’ll love working with Checkmk
The 2.3 release of Checkmk introduces numerous minor and major enhancements that make daily monitoring tasks easier. For example, you can simulate events and test notifications. Revised workflows, improved with community input, also make Checkmk more intuitive and easier to use.


Simulate and test notifications
Notifications are among the most important functions of monitoring – and Checkmk has one of the best notification systems on the market. With Checkmk 2.3, you can now easily simulate and/or test your notifications for any host or service. Simulate specific events directly through the Checkmk UI and decide whether Checkmk should trigger a proper notification. This allows you to test without much effort which notification rules apply in a specific incident.
The new function Test Notifications also allows you to trigger notifications in various scenarios. Test sending notifications outside business hours that only trigger an escalation after a set number of repeat notifications. This way, you ensure that your monitoring notifications function as expected in an emergency.
2FA via software authenticators
Starting with version 2.3, it is possible to use software authenticators (authenticator applications on the smartphone) that generate a time-based one-time password (TOTP) for two-factor authentication (2FA). As a result, Checkmk now supports an additional 2FA option. Previously, Checkmk offered a two-factor authentication via FIDO2-compliant hardware supported by the browser and operating system in use.


Intuitive workflows
Version 2.3 enhances numerous workflows in Checkmk to make them even more intuitive. This release improves the confirmation messages and related command dialogs in Checkmk, making them uniform and user-friendly. Specifically, the dialog windows for scheduling downtime ("Schedule downtime") and acknowledging problems ("Acknowledge problem") are now clearer and easier to use. You can immediately see which options are available and what their effects are.
New features for error-free usage
To prevent errors and make expiration dates more visible, the dialog window for acknowledging problems now displays the current server time. When configuring downtime ("Schedule downtime"), you can easily navigate through the various options in the command dialog from top to bottom. Additionally, you have the option to set the date and time via user-friendly selection fields based on your browser's default settings.


Easily create your own Checkmk extensions
Developing and maintaining extensions for Checkmk is now easier than ever. With Checkmk 2.3, modern development tools fundamentally simplify the plug-in development process. All components of a plug-in are now organized in clear modules. This allows you to develop and test plug-ins independently of Checkmk, avoiding unwanted interactions with other modules. Additionally, each extension utilizes a clearly defined, versioned interface (API), ensuring improved consistency and stability in your work.
Cloud meets Checkmk MSP
Specially developed for IT service providers, Checkmk MSP benefits from the features of Checkmk Cloud starting with version 2.3. The comprehensive cloud and OpenShift monitoring allows Managed Service Providers to monitor cloud infrastructure and containerized applications within customer infrastructures, optimizing performance and availability.

Reduced workload thanks to powerful agent features
The agent features from Checkmk Cloud enable a more flexible and efficient monitoring of customer infrastructures. Thanks to the push mode of the agents, monitoring data can be actively sent to the central Checkmk instance without the need for a remote site. This saves MSPs time and significantly simplifies the onboarding of customers with smaller IT environments.
The auto-registration of hosts also significantly minimizes manual effort. The ability to automatically incorporate new systems into the monitoring system allows MSPs to more efficiently manage customer infrastructures.
Faster rollout of changes
With version 2.3, the preparation phase for rolling out changes on remote sites in Checkmk MSP is also accelerated. Thanks to additional caching and improved storage of intermediate results, the waiting time is noticeably reduced.