Powerful, easy-to-use network monitoring software
Reduce downtime in your network with the network monitoring of Checkmk and discover hidden issues impacting the bandwidth to ensure maximum productivity for your users.
-
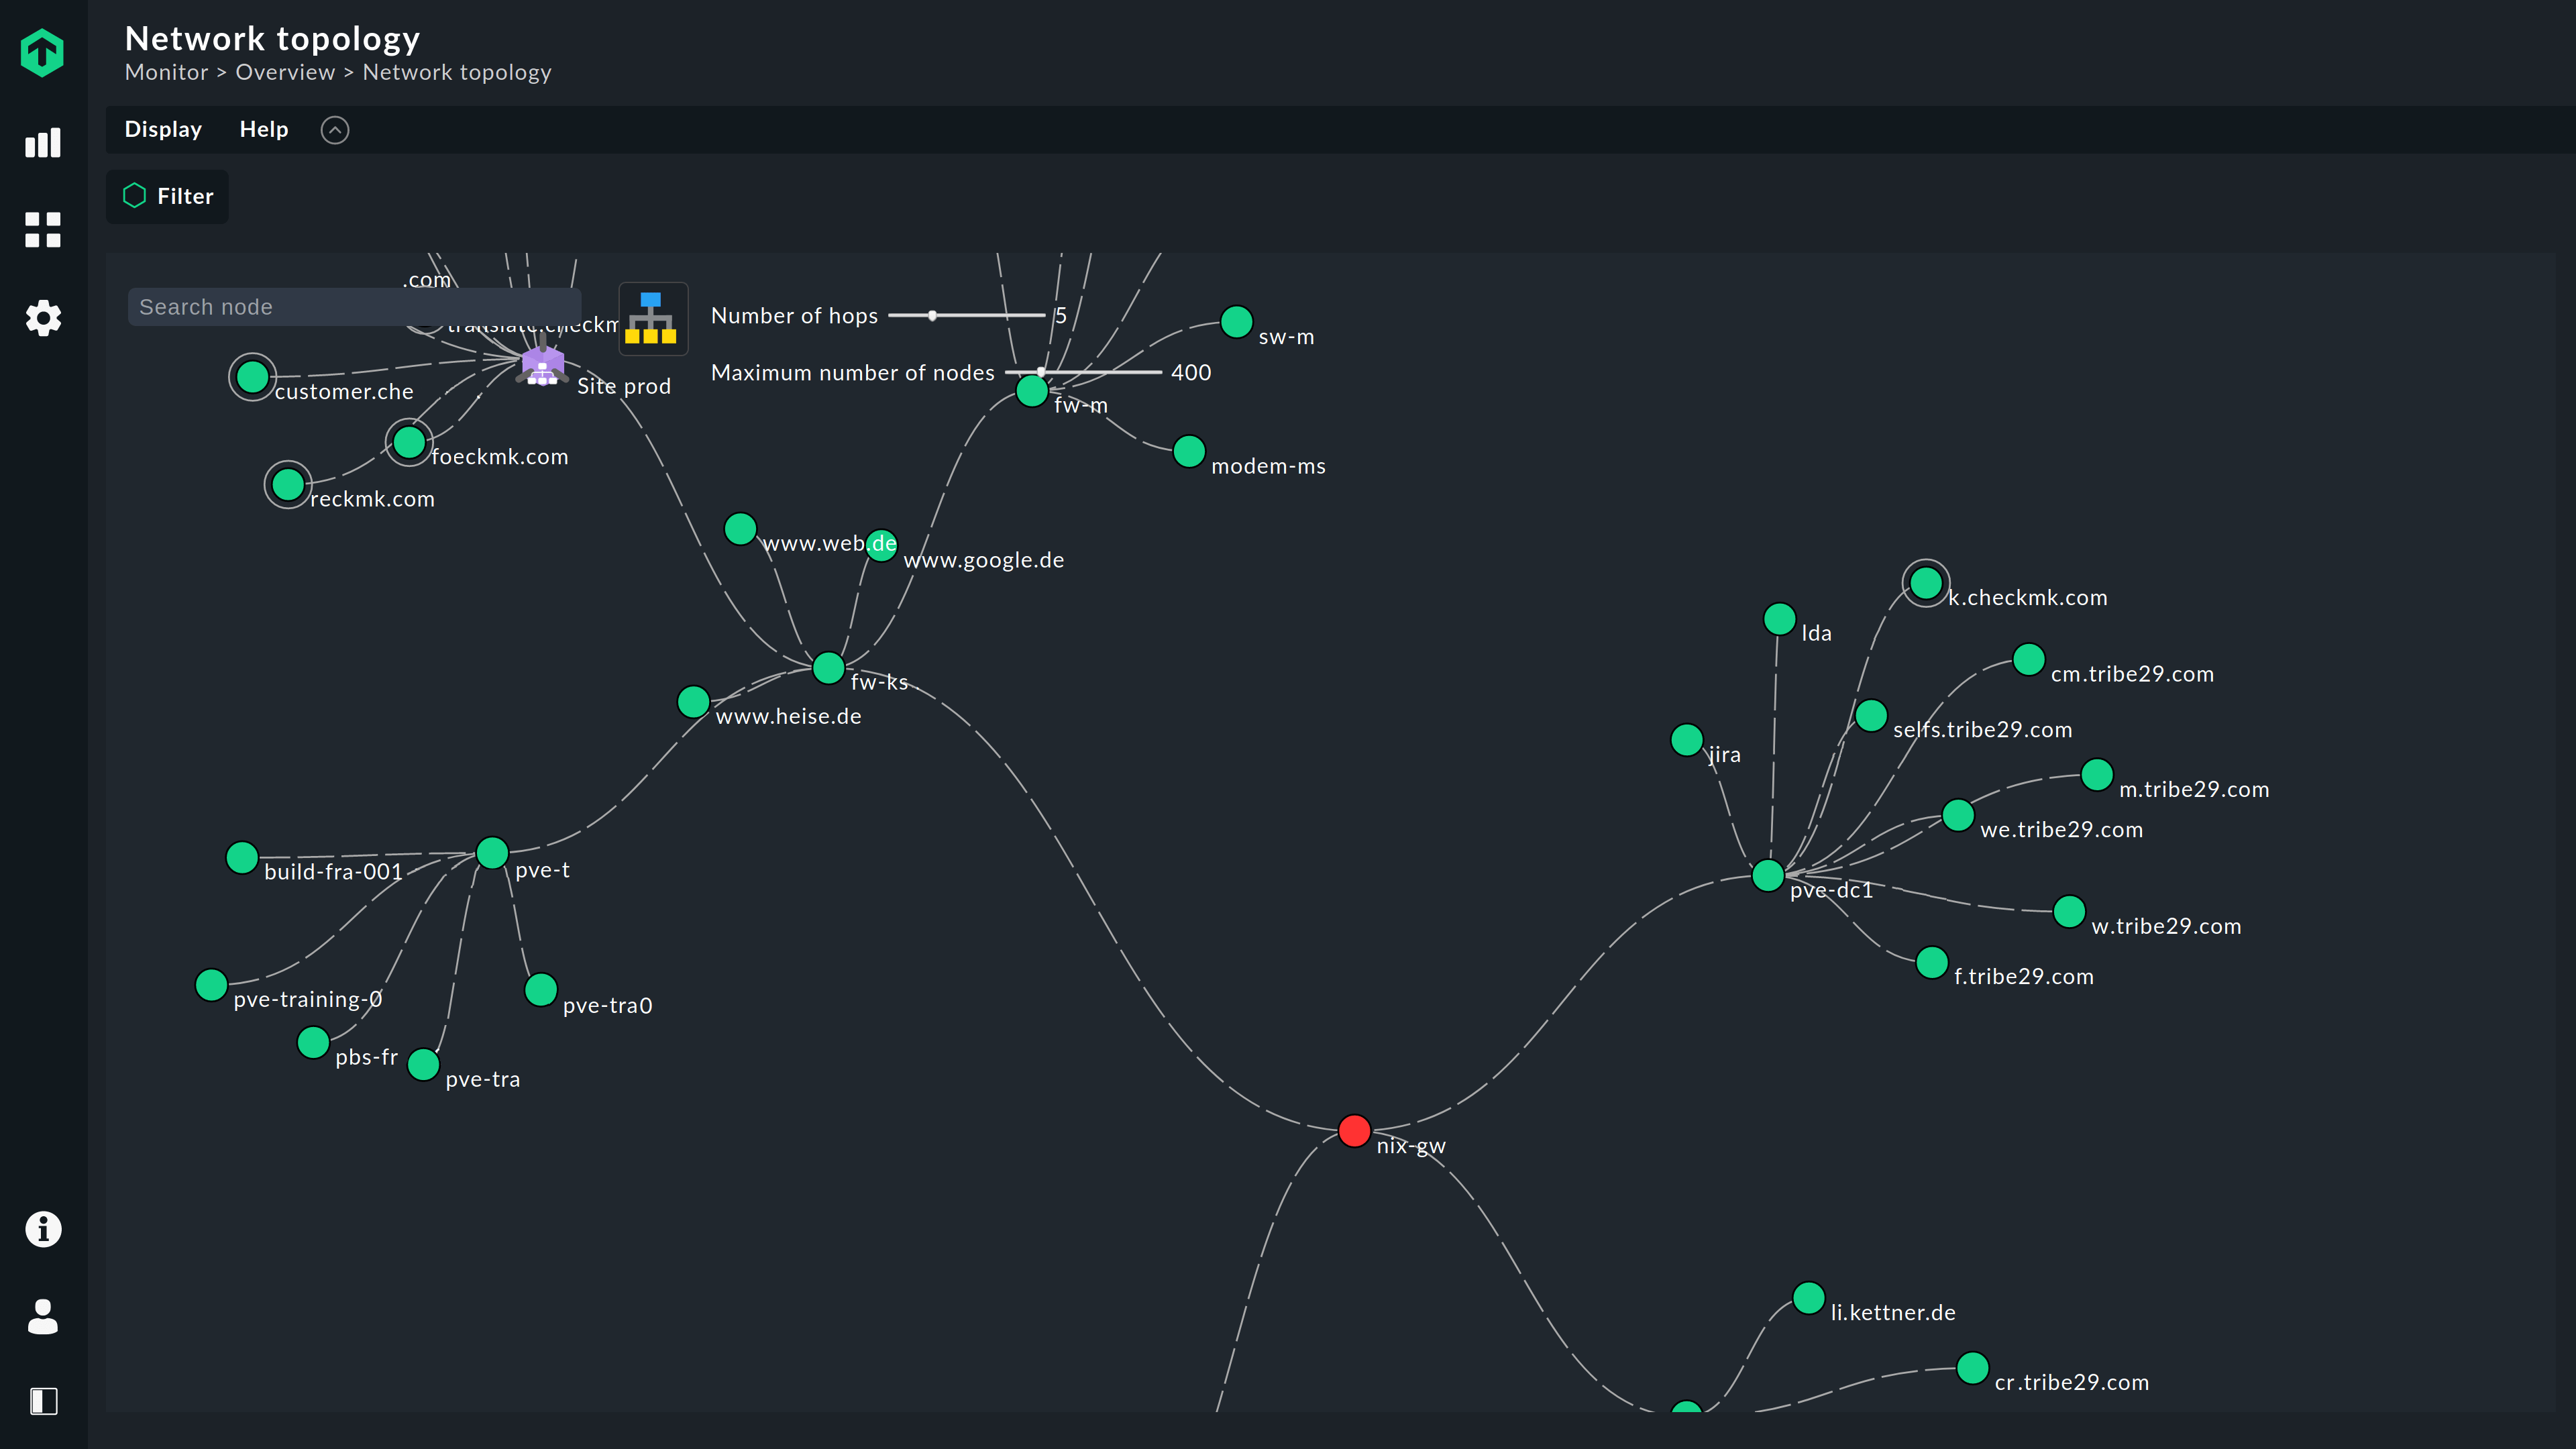
Gain visibility into your whole network — no more flying blind
-
Discover hidden issues impacting the performance of your network
-
Find faster solutions by quickly eliminating sources of potential problems
-
Set up a holistic network monitoring for all of your network ports in minutes
-
Discover problematic trends using real-time and historic data
Some of the vendors we support
An easy to set-up holistic network monitoring software

Your whole business depends on an efficiently-functioning network infrastructure. However, even networks in small companies can get hugely complicated over time and it is easy to lose the overview and have difficulty keeping an eye on everything. A good network monitoring software can help to handle this issues.
Checkmk as a network monitoring tool can help you quickly monitor your entire network and it doesn’t cover only the major devices, but also a broad range of vendors — even those outside the mainstream. And this all without complicated configurations and endless alarms. With a few clicks, you will be able with this network monitoring tool to monitor all your network devices, e.g.:
- Switches & Routers — Monitor packet rates, error rates, the state and bandwidth of ports, CPU utilization, fans, power supply, temperature and more. Supported devices for network monitoring include, e.g. Alcatel-Lucent, Cisco, Brocade, Dell, Enterasys, Extreme Networks, Huawei, Intel, Juniper, TP-Link.
- Wireless — Also monitor your wireless networks, e.g. state of access points, signal strength and connected devices for Aerohive, Aruba Networks, CBL, MikroTik, Netgear, Fritz!Box, etc., devices.
- Firewalls — Ensure the security of your network by monitoring the health, VPN tunnel state, high availability state and more of your BlueCat, Checkpoint, F5, FireEye, FortiGate, IBM, Palo Alto Networks, etc., devices.
Ultra efficient network monitoring
Checkmk uses a rules-based concept for configuring your network monitoring. This becomes especially powerful when monitoring a large number of similar devices, in contrast to a template-based approach, in which you need to configure each 'sensor'.
With just a couple of rules you can configure your entire network monitoring, e.g. monitoring only the error rate for access ports. Routers and switches can have several hundred SNMP messages – it is important to monitor only what really matters. Checkmk knows what data matters, and filters the data for you so that you get to see the data you actually need in your network monitoring.
For small networks and ISPs
Checkmk comes with more than 2,000 preconfigured checks and it is highly likely that it can monitor any switch, router or firewall you may have.
You can monitor the network interfaces of low-end switches with just a couple of ports. But you can also monitor huge core switches with several hundred ports or the devices powering the internet — monitor BGP sessions, routing engines, fans, memory, file systems and more for your BGP routers.
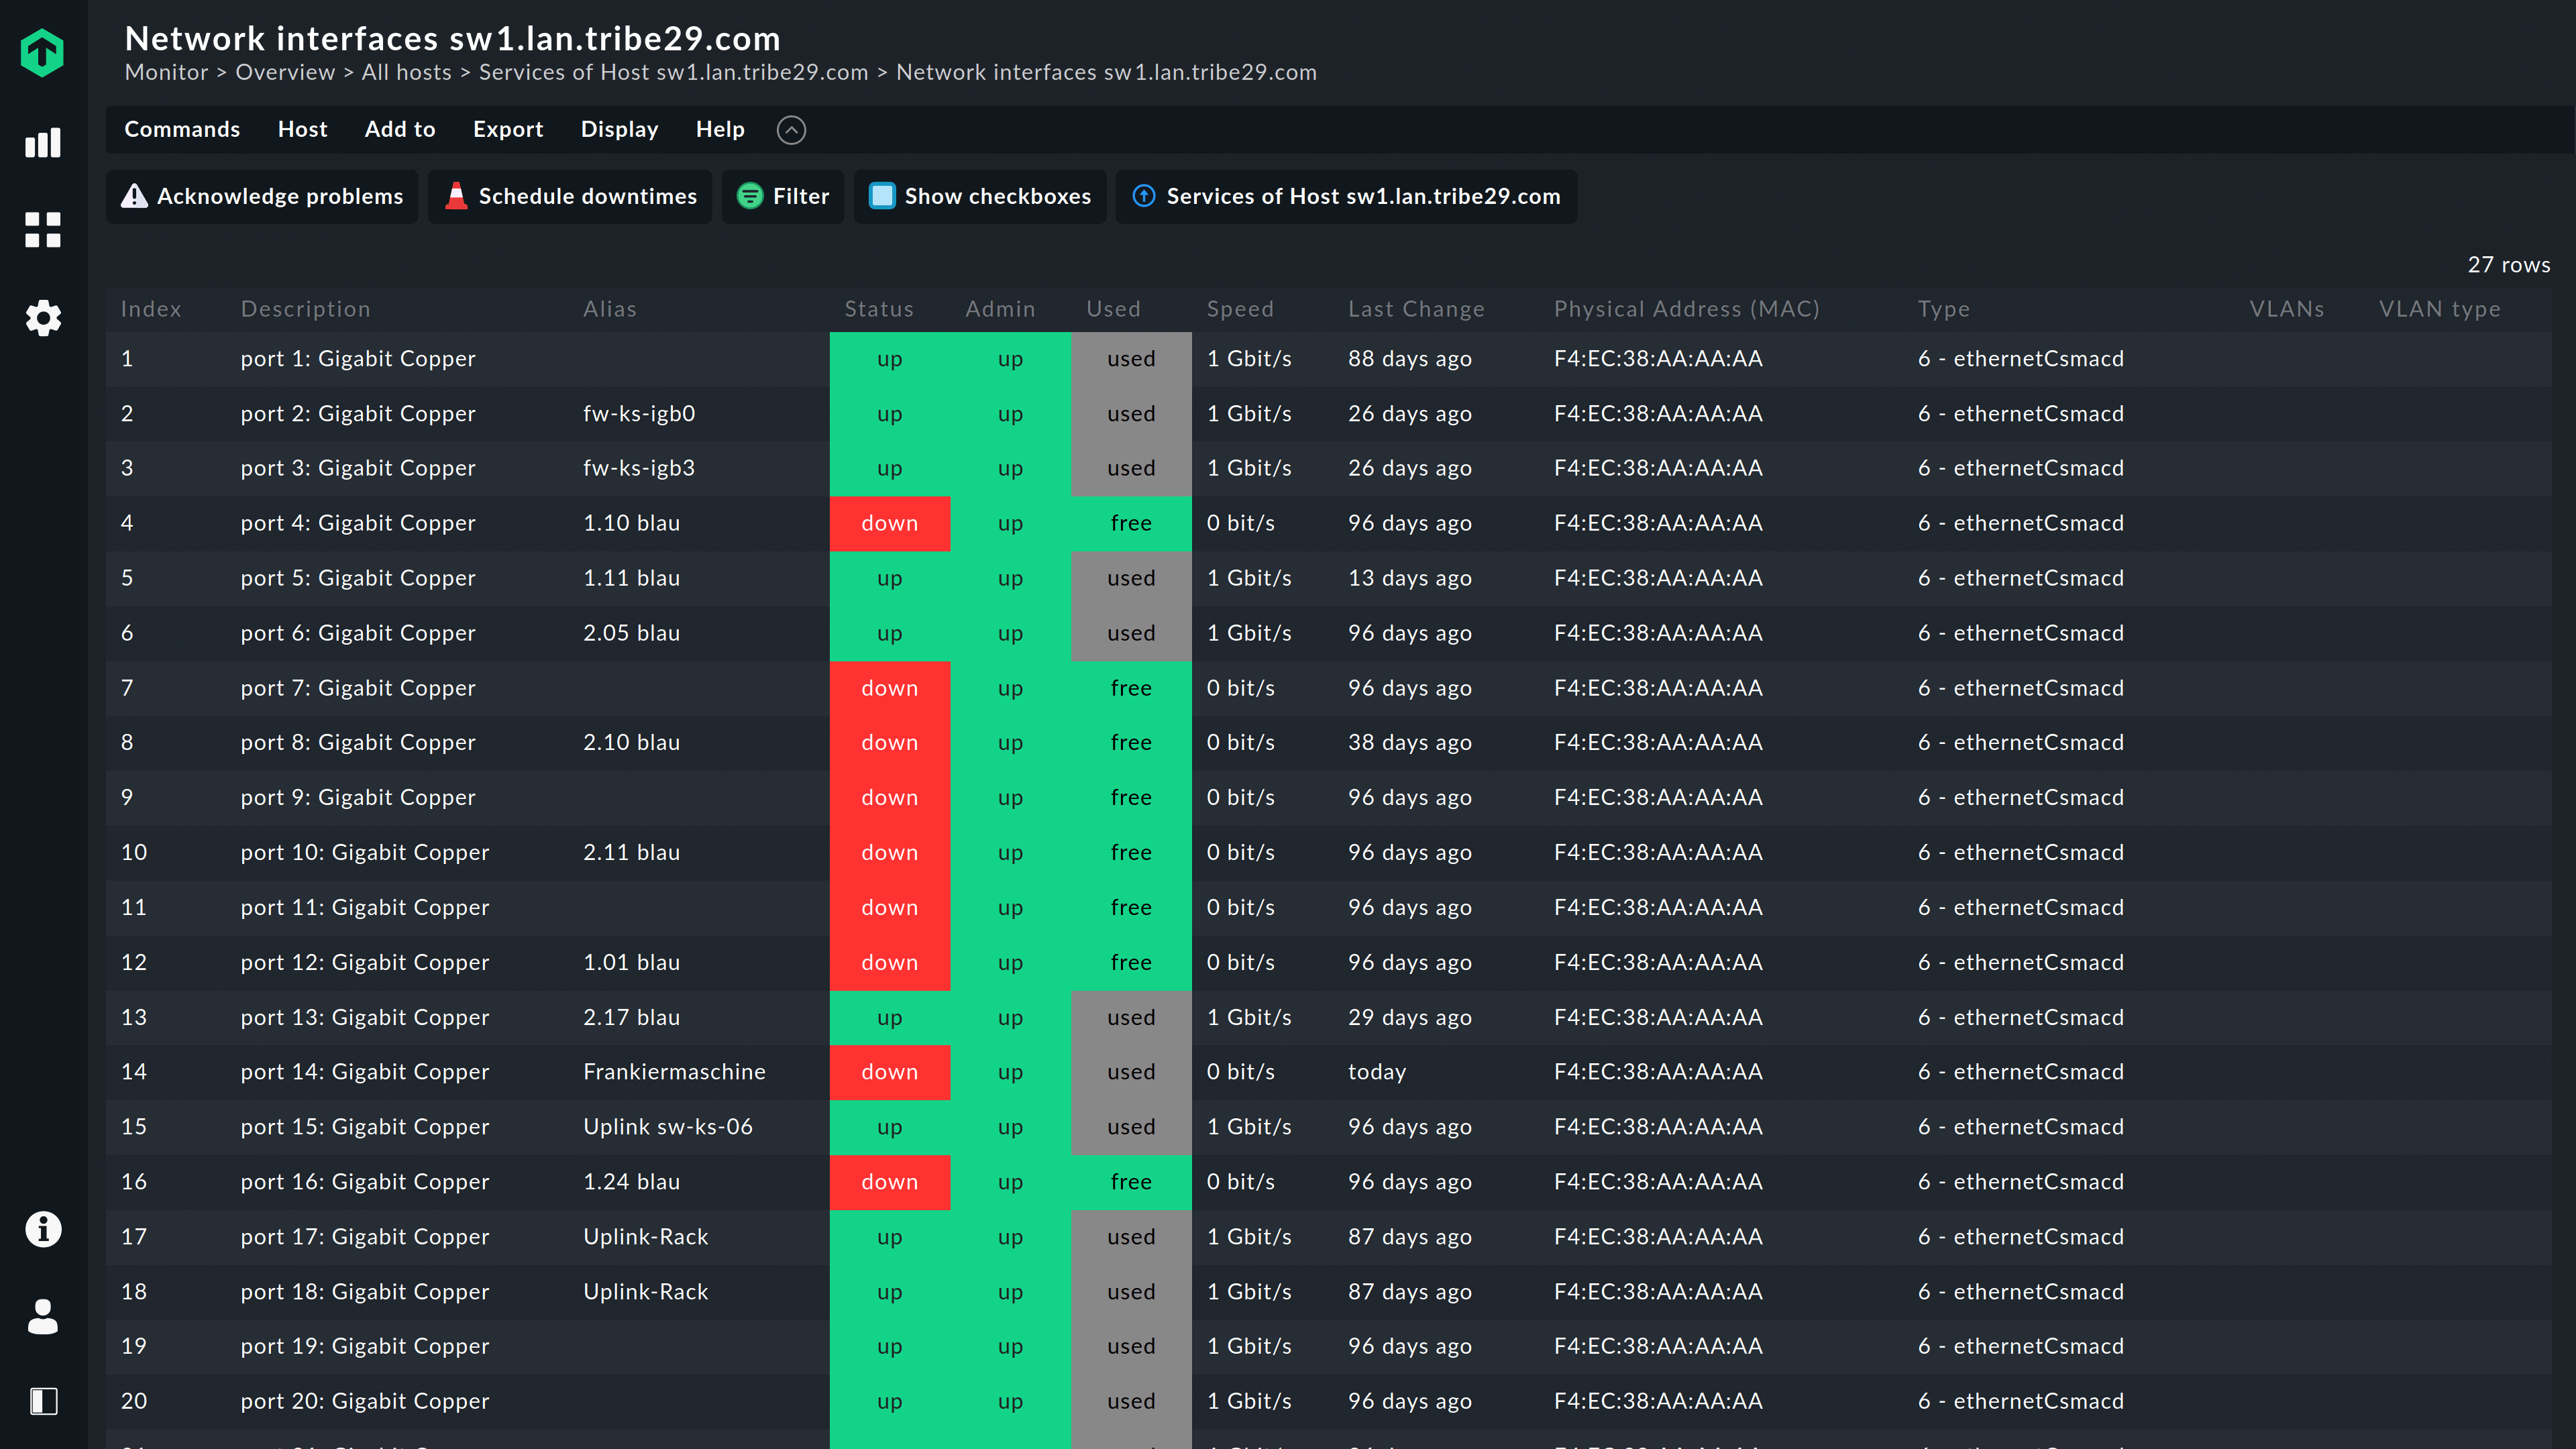
Understanding switch port usage
Have you ever stood in front of a switch and wondered which ports are actually being used, and which not, or that someone hasn't simply removed a cable? Have you ever unplugged your CEO from the internet because the port looked as if it was not in use, but he was in fact just on a business trip?
Checkmk combines real-time data and historic data in its network monitoring to understand which of a switch's ports are in use. With the switch port statistics feature, you can see immediately which port is up/down/free, the speed, whether it is currently being used, and the last time when it was in use.
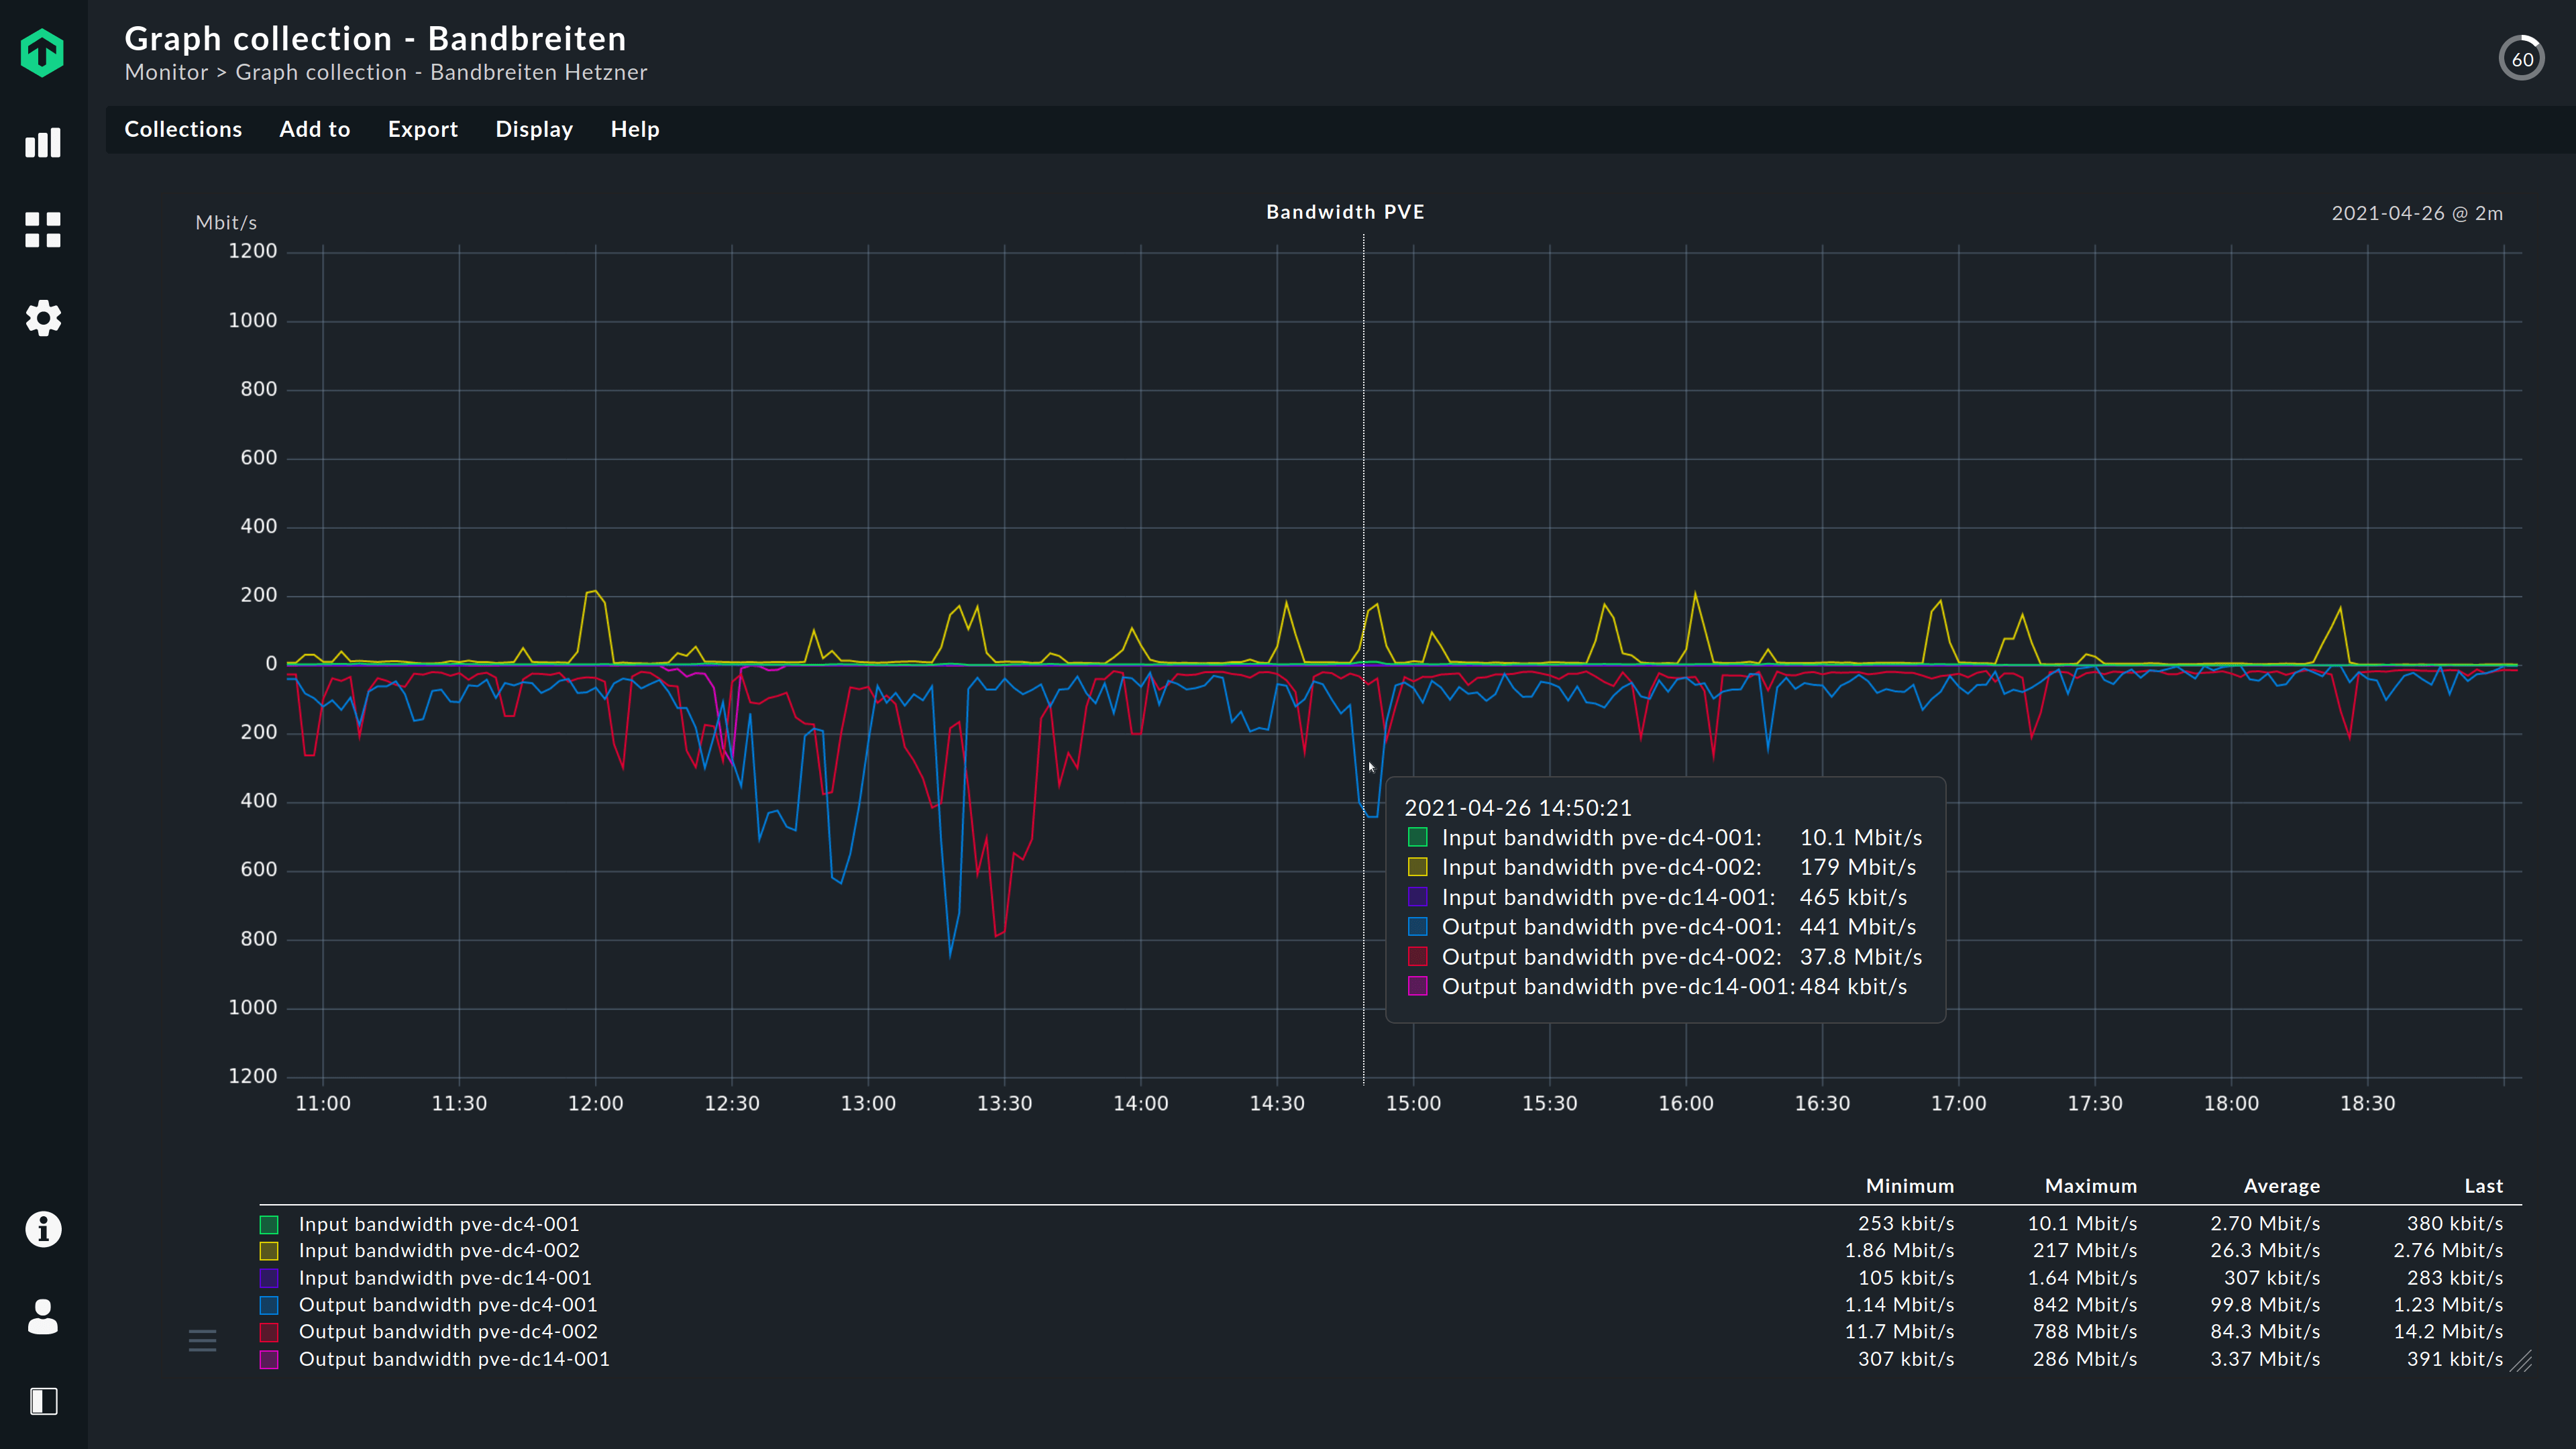
Avoiding bottlenecks with bandwidth network monitoring
Checkmk not only monitors all network interfaces in an IT infrastructure but also the bandwidth consumption at each port. Bandwidth network monitoring with Checkmk enables you to:
- Monitor all ports and the bandwidth usage for each port.
- Set thresholds for individual ports to receive alerts when bandwidth consumption is high.
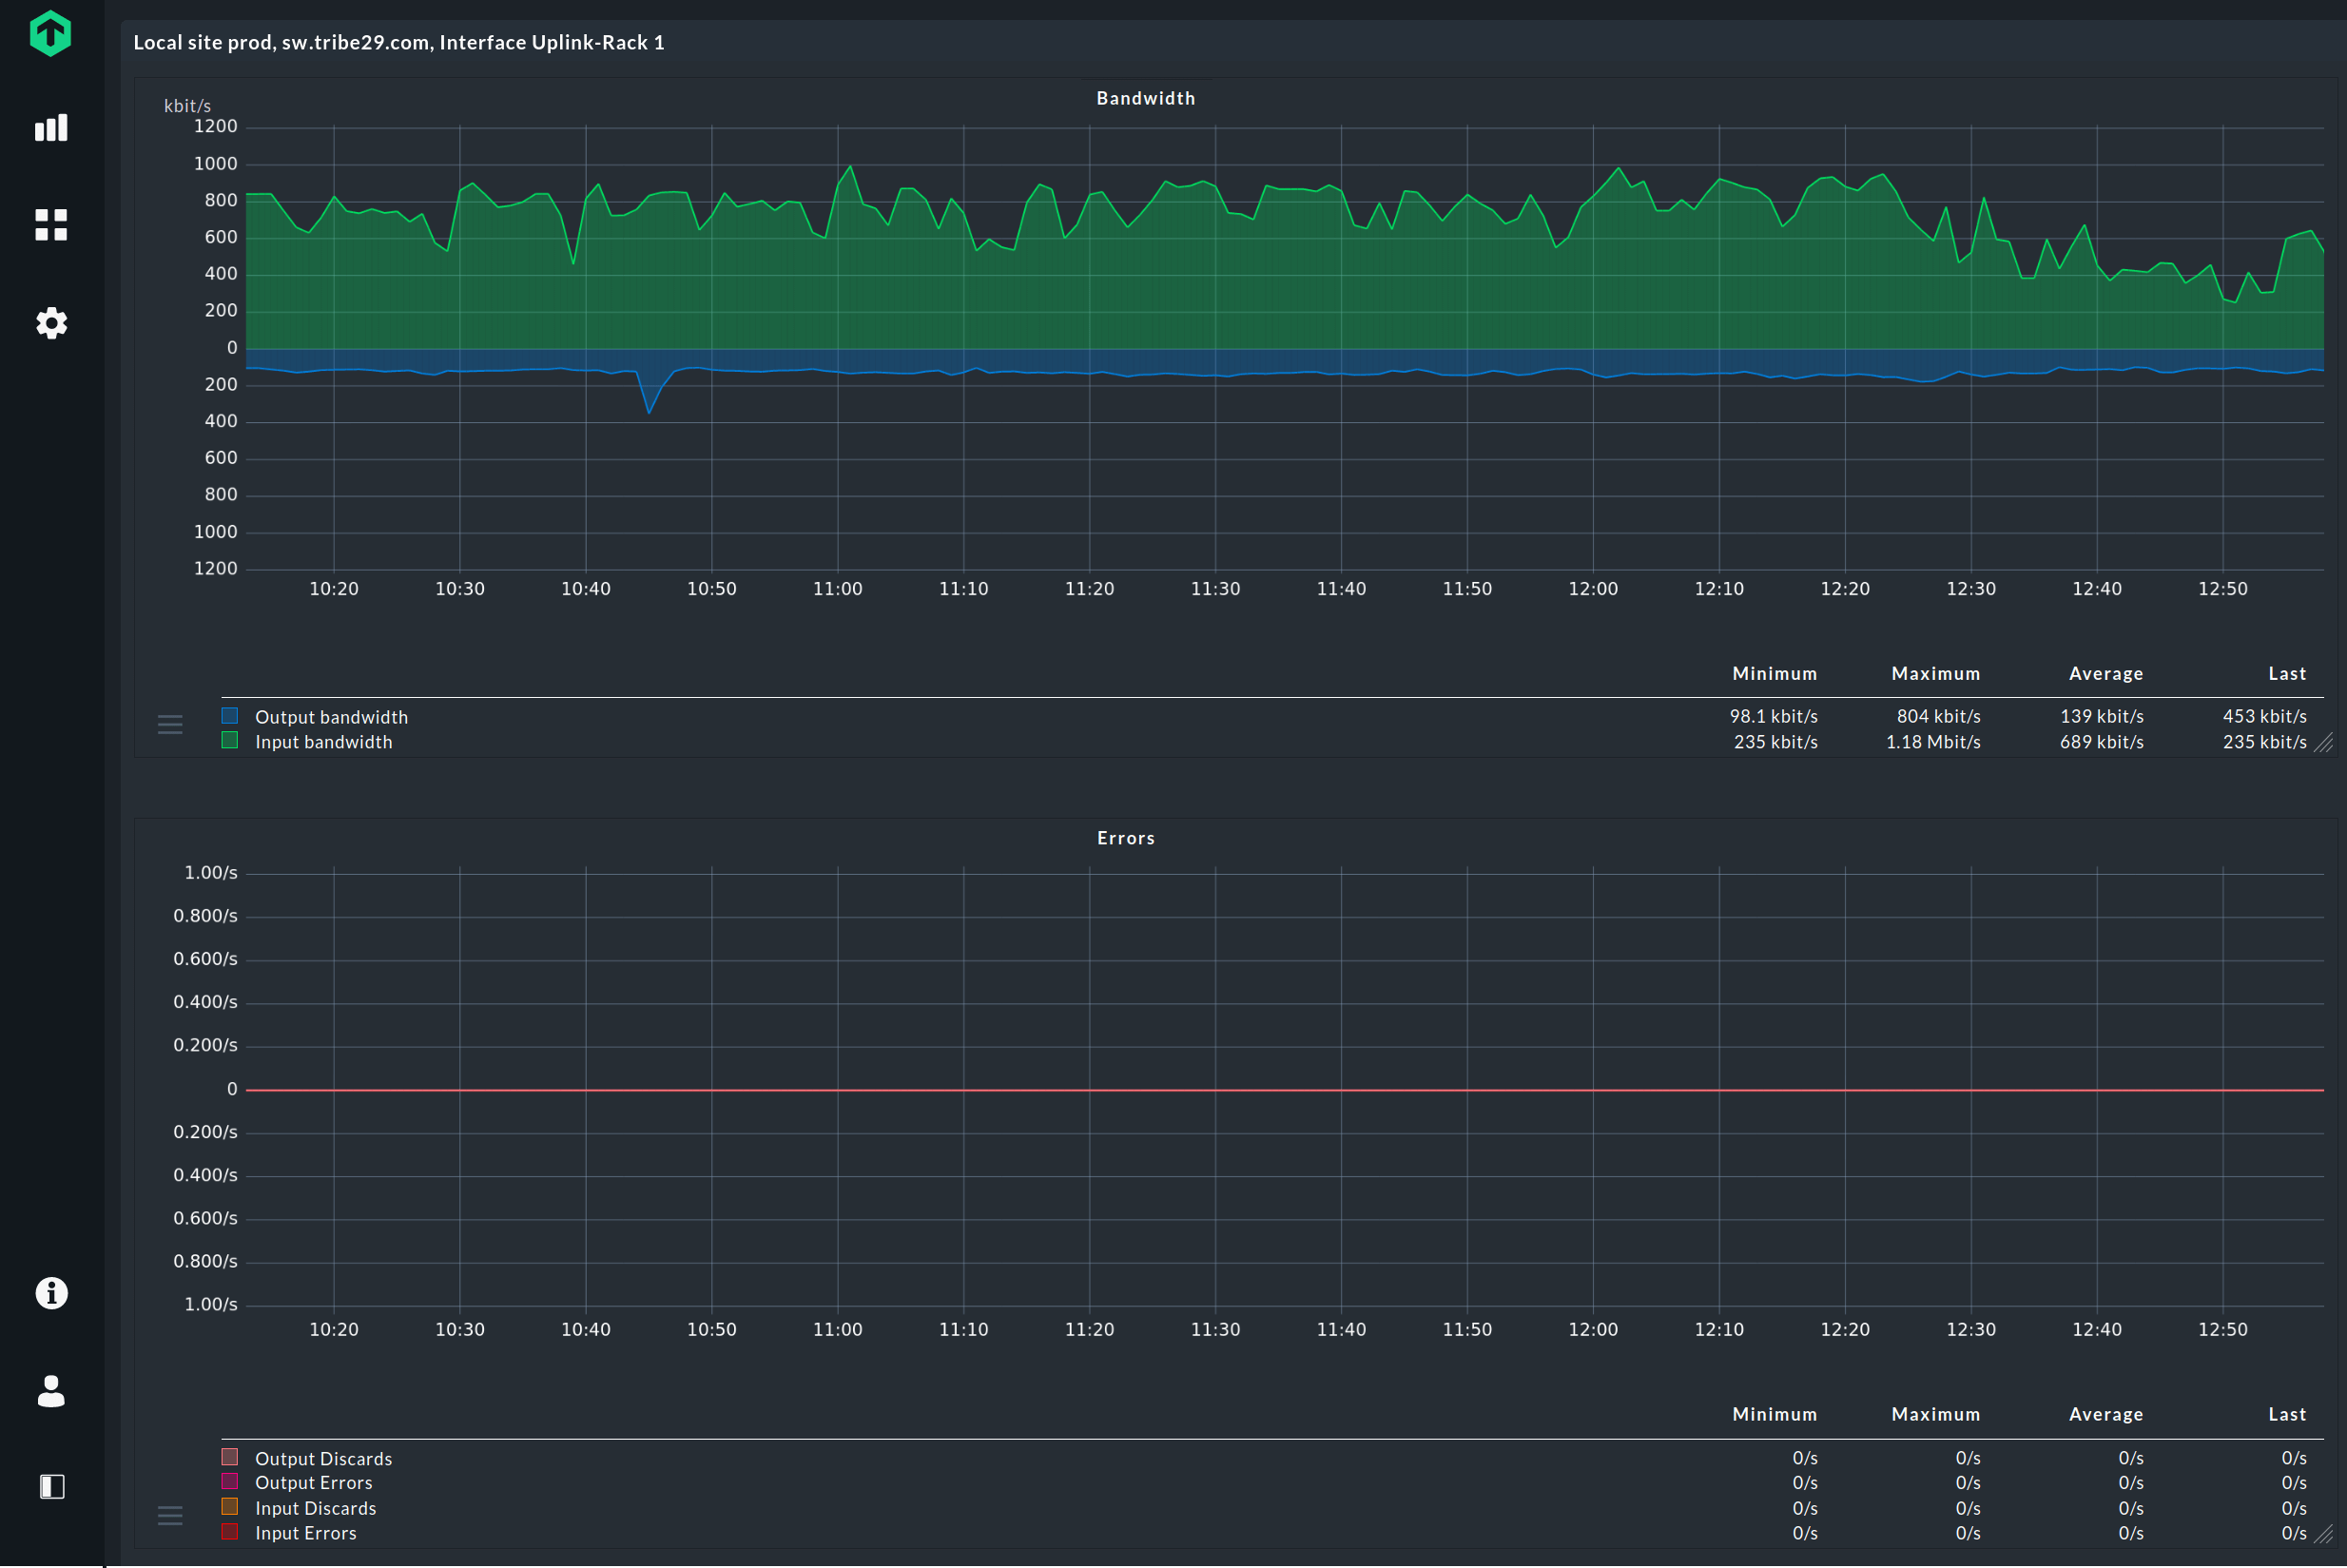
- Quickly identify bandwidth-related peaks and patterns with powerful time series graphs.
- Set the assumed input and output speed on Internet and WAN ports for improved alerting.
- Measure network and internet performance by integrating Speedtest or iperf into Checkmk via plugins.
Deeper insight into the used bandwidth is allowed by integrating ntop into Checkmk.
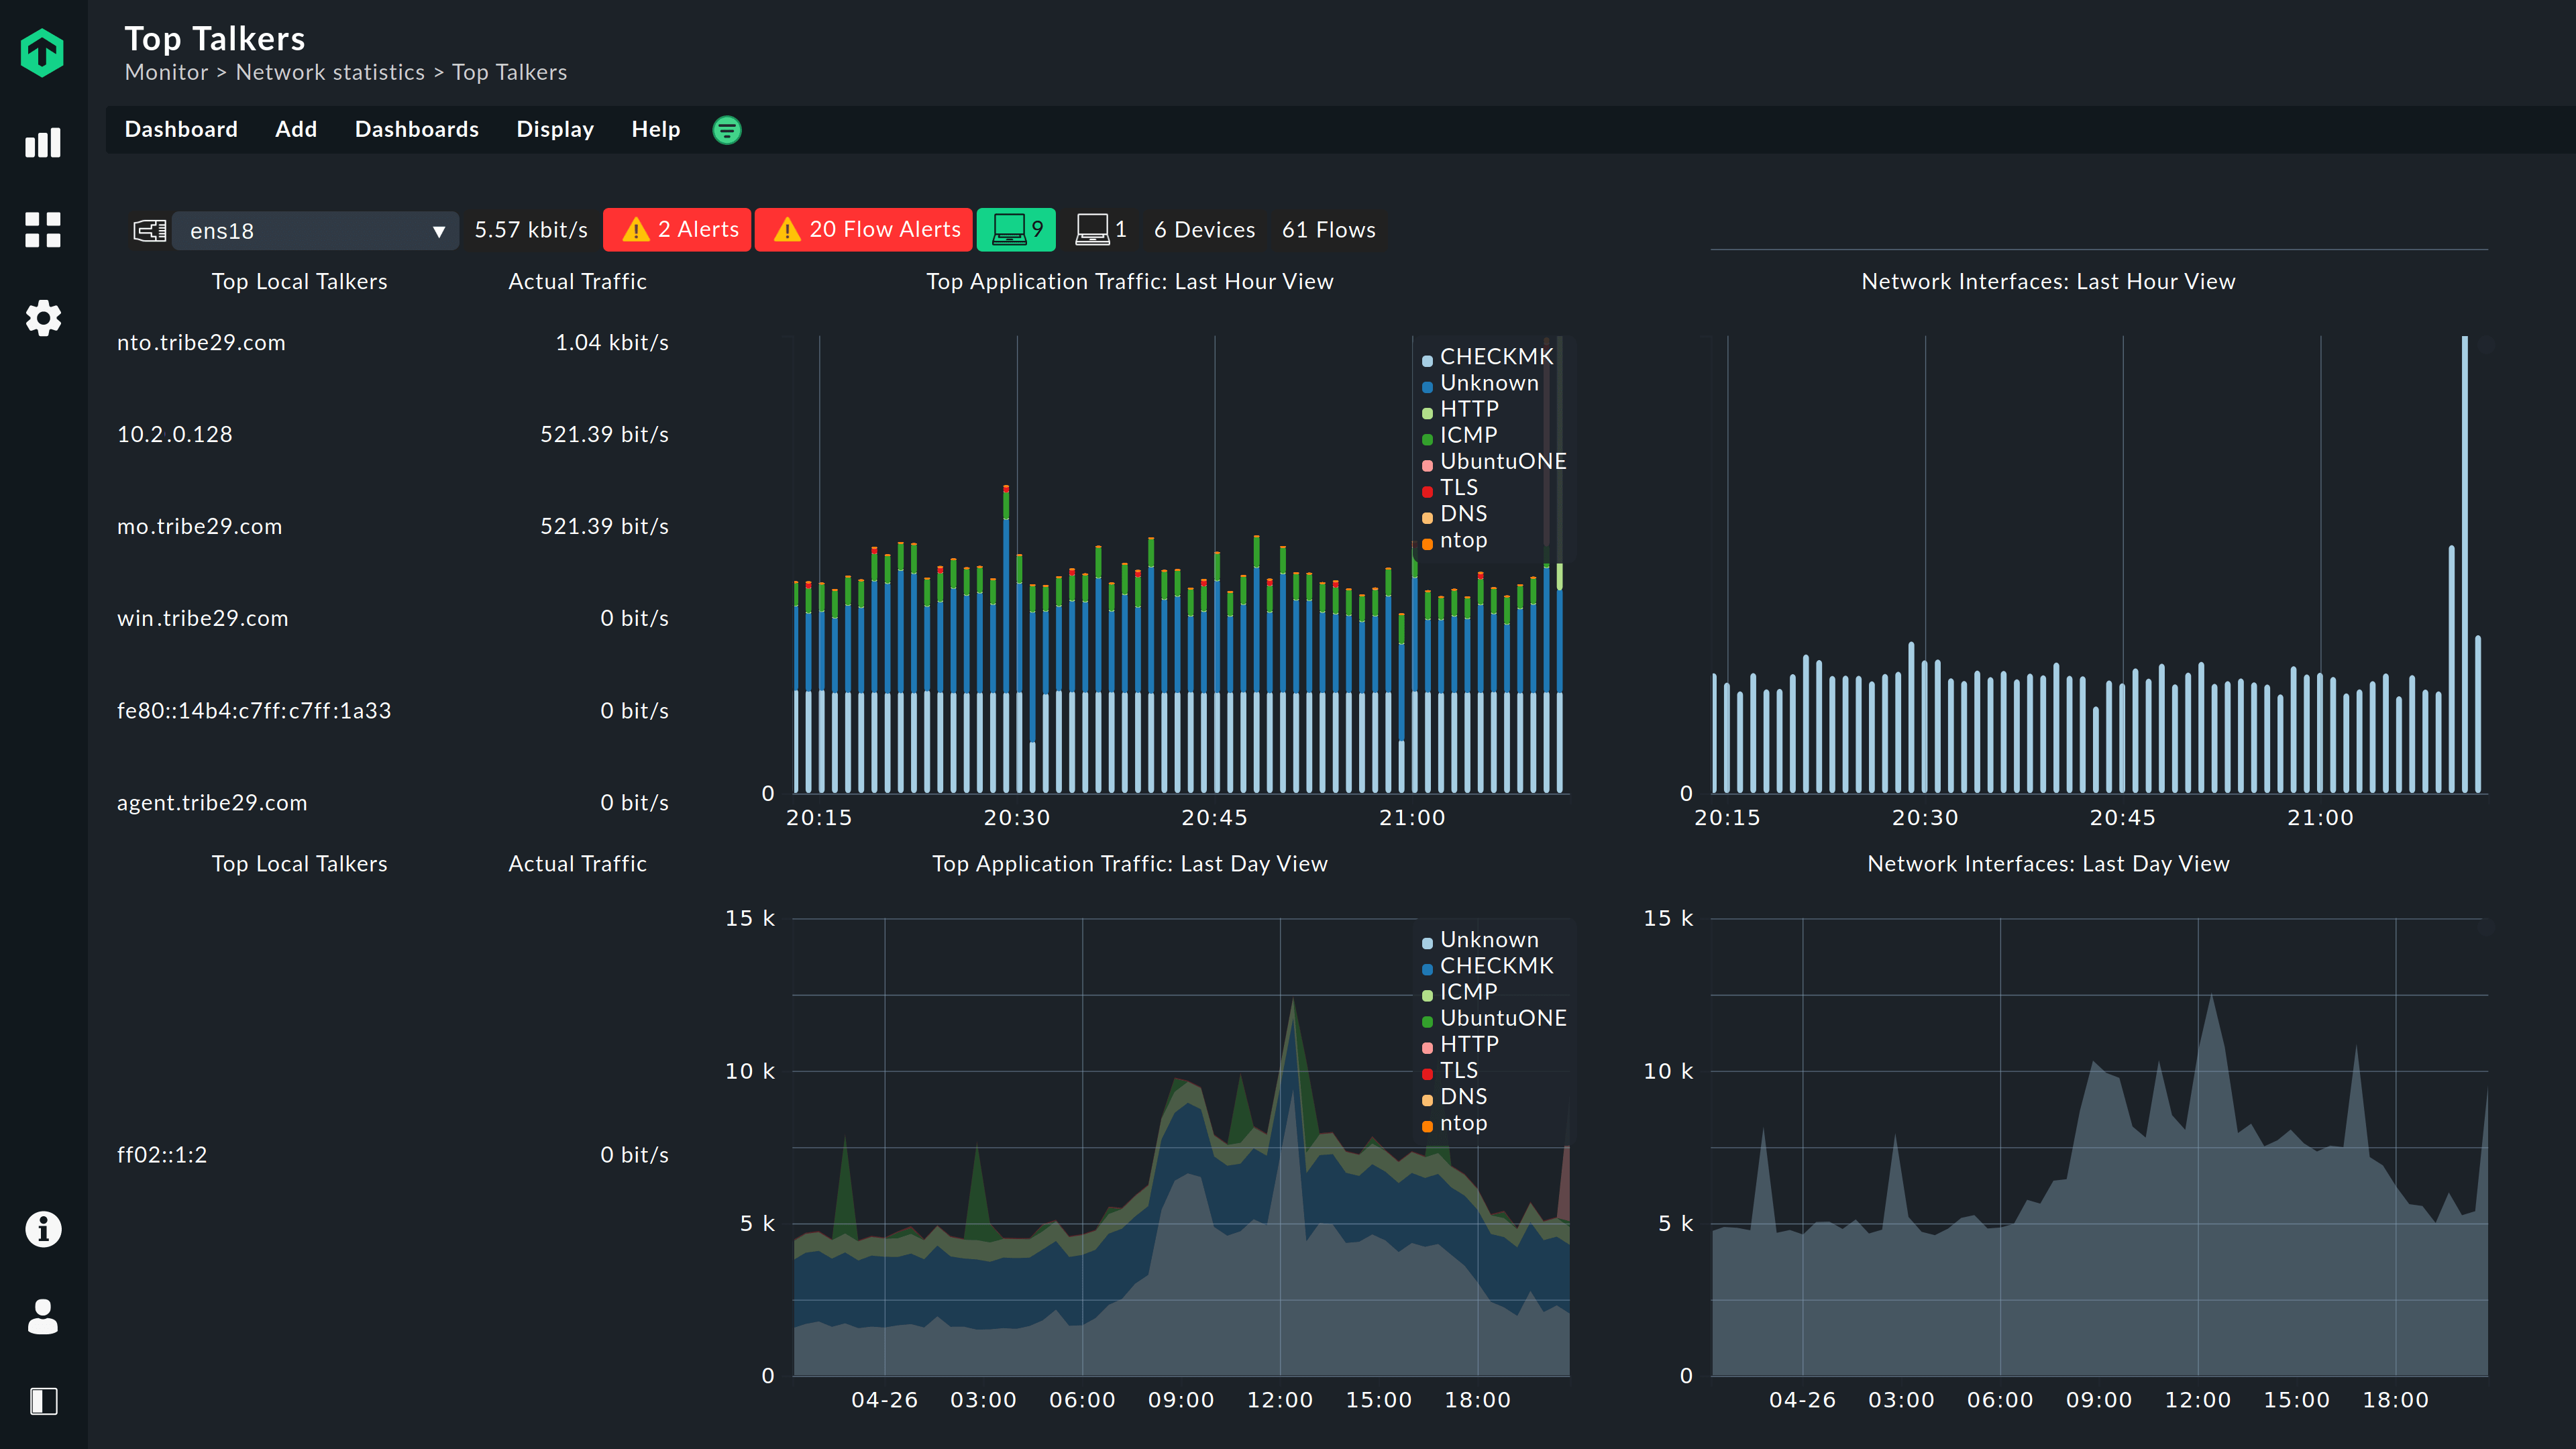
Network flow monitoring
In addition to comprehensive network monitoring, the Checkmk Enterprise Edition starting from version 2.0 optionally supports monitoring of network flows. Checkmk is able to integrate network flow data provided by ntop and allows you to get an even more detailed monitoring of your network. You can analyse your network traffic in-depth without having to leave the Checkmk interface.
By analyzing flow data, you can learn which hosts, applications, or protocols are communicating with each other. This allows you to break down network usage per host, destination address, protocol, or application to see what the top talkers and top listeners are on your network. In addition, network flow monitoring helps you detect bottlenecks or anomalies in your network infrastructure.
With Checkmk you have all the data in your Checkmk main dashboard. Checkmk gets all the information from ntop. Furthermore, you can view all flow information and analyze all flow-specific alarms via the alert dashboard. In addition, the flow data provides you with supplementary information on each host, such as traffic packets, ports, peers and applications.
Learn all about network flow monitoring with Checkmk.
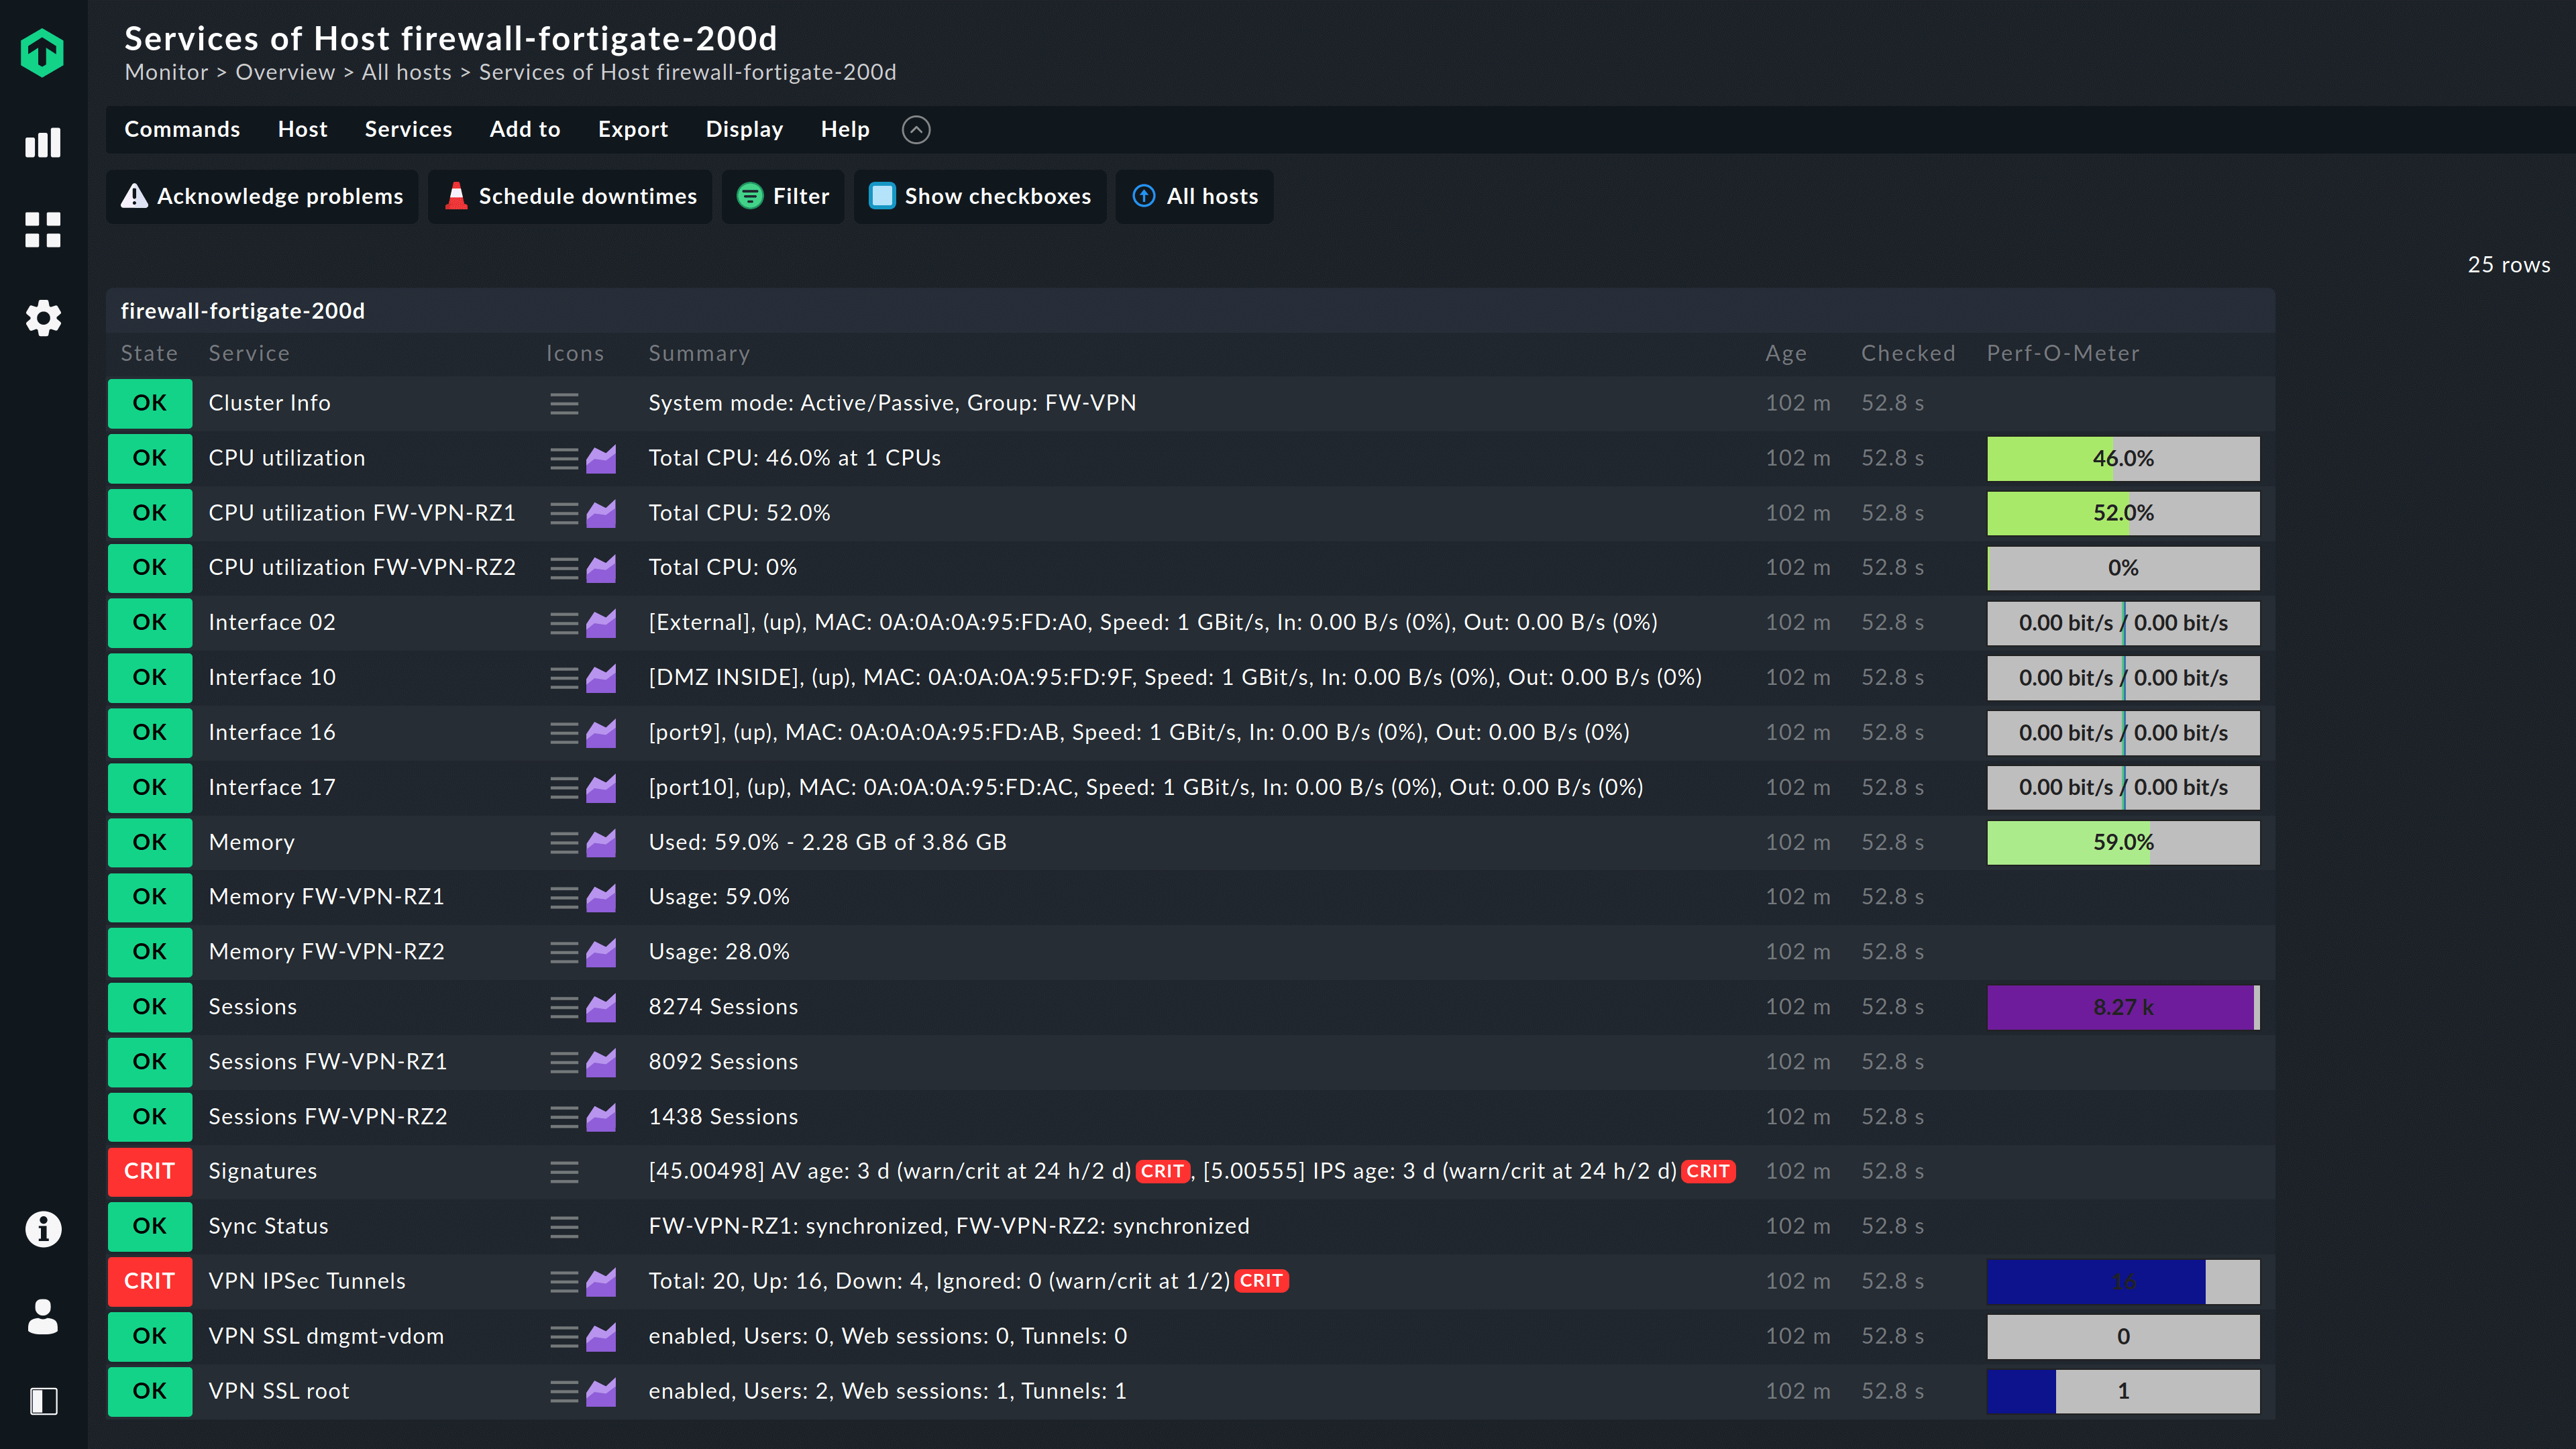
VPN and remote workplace monitoring
Avoid capacity bottlenecks, bandwidth and performance issues, or configuration errors from slowing down your VPN and remote workplace architecture. This is the only way to ensure that your employees can easily access the tools and applications they need from home or wherever they work.
With Checkmk as your network monitoring software you are able to monitor the status and the number of your active VPN tunnels and the number of bytes being transferred via VPN, so that you can detect problems early and guarantee secure remote access to your company infrastructure at any time.
Prevent your VPN gateway from becoming a bottleneck in your remote architecture by easily monitoring device CPU usage with Checkmk. In this way Checkmk helps you to react to possible bottlenecks at an early stage.
With remote workplaces it is useful to monitor several parameters simultaneously to ensure smooth operation. Here, too, you should always keep an eye on the performance utilization of your gateway. Checkmk also helps you to keep an eye on the resource capacities of your virtual platform. Only if sufficient CPU, RAM or Storage IO are available, can a smooth operation and a possible scaling of the virtual workstations be guaranteed.
Great reasons to choose checkmk as your network monitoring tool

Compatible with almost anything
Checkmk supports the monitoring of almost every network device.

Ultra-scalable & Flexible
One Checkmk instance can monitor thousands of servers and can easily scale horizontally with our distributed monitoring setup.

Intelligent Monitoring
Checkmk intelligently discovers which metrics to monitor without needing any additional configuration.

It's fast to get started
Checkmk enables you to go from zero to monitoring in less than 15 minutes. Installation is super easy and fast!
With Checkmk we have visibility and insight into the systems and applications that power our business. We know the lifecycle and usage patterns of our systems thanks to Checkmk and this is really a powerful feature when making important business decisions regarding these systems. We do not have to do guess work, it is a matter of pulling up the right view or generating the report and looking at the details.
Trusted by global brands and local organizations worldwide


Resources
Try it yourself
Talk to us
Learn more about Checkmk
Ready to explore the full feature set of Checkmk?
Download the free trial and see it in action.